PRINCETON, NJ -- Barack Obama's newfound momentum in the Iowa and New Hampshire Democratic presidential contests -- rising from second or third place into competition with Hillary Clinton for first -- seems to have reset national Democratic preferences for Obama and Clinton to where they were in late summer and early fall. After a period from mid-October to mid-November when Â鶹´«Ã½AV's national polling found Clinton's lead over Obama rising from about 22 points to nearly 30 points, Clinton now leads Obama by just shy of 20 points, similar to her standing in September and early October.
Though Obama's national position among Democrats (including independents who lean Democratic) has recovered somewhat since November, Clinton still leads by enough that she continues to dominate the race at the subgroup level. Obama runs more strongly with some groups than others, but Clinton outpaces him among nearly every major demographic and political subgroup.
According to aggregated data from Â鶹´«Ã½AV's two most recent national surveys, conducted between late November and mid-December, Clinton's strongest leads for the nomination are among seniors, women, lower- and middle-income as well as lower-educated Democrats, Easterners (the East being Clinton's current region as U.S. senator from New York), and Southerners (the South being her former region as first lady of Arkansas). Clinton's advantage over Obama among these groups ranges from 22 to 35 points. Clinton also enjoys solid leads among non-Hispanic whites, blacks, Westerners, and pre-seniors (aged 50 to 64).
Relative to other groups, Obama does best among men, voters under 50, upper-income and upper-educated Democrats, and those living in the Midwest (the region of his home state of Illinois). However, he does no better than tie Clinton among any of these groups.
The detailed results by subgroup, showing the percentages of each group supporting Clinton, Obama, and third-place candidate John Edwards, are found elsewhere in this report.
Political Patterns
On the basis of partisanship, Clinton is preferred to Obama by a 24-point margin among rank-and-file Democrats (48% vs. 24%) but by only a 2-point margin (32% vs. 30%) among independents who lean Democratic.
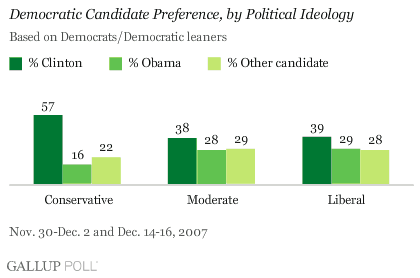
Â鶹´«Ã½AV also finds a sharp difference in candidate preference according to Democrats' self-described political ideology. Only one in five Democrats consider themselves "conservative" politically, but those who do are overwhelmingly in Clinton's corner. Clinton has much smaller leads (10 points each) among "moderate" and "liberal" Democrats.

The Age and Gender Divide
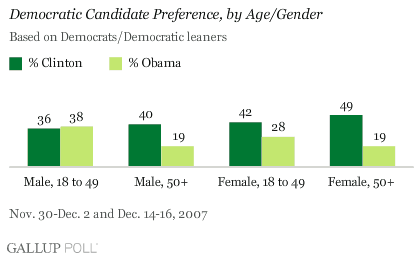
The influence of gender and age in voter preferences between the two leading Democratic candidates -- with Clinton most popular among women and seniors -- is evident when looking at the four major age/gender categories of voters. Clinton has a 30-point lead over Obama among women aged 50 and older, but trails Obama by two percentage points (not a statistically significant margin) among men aged 18 to 49. This is one of the few subgroups among whom Obama comes close to leading Clinton.
Age appears to prevail over gender when it comes to the other two age/gender groups: Clinton has a 21-point lead among older men, compared with a 14-point lead among younger women.

Other Findings
Although Edwards is polling well in Iowa -- possibly well enough to win that state's caucuses when they are held on Jan. 3 -- at this point he and all other Democratic contenders are far behind Clinton and Obama in terms of being major contestants for the Democratic nomination. Still, there are a few noteworthy distinctions in the demographic support patterns for some of the less prominent candidates:
- Edwards is supported by 18% of non-Hispanic white Democrats, but only 3% of blacks.
- Support for Joe Biden is highly correlated with age, with the percentage choosing him rising from 2% of Democrats aged 18 to 49 to 6% of those 50 and older.
- Biden's support is also more concentrated among moderate Democrats (6%) than among liberal (2%) or conservative (2%) Democrats.
Survey Methods
Results are based on two nationally representative USA Today/Â鶹´«Ã½AV and Â鶹´«Ã½AV Poll surveys conducted Nov. 30-Dec. 2, 2007, and Dec. 14-16, 2007. The combined database includes 1,007 Democrats and independents who lean Democratic. For results based on the total sample of Democrats and Democratic leaners, one can say with 95% confidence that the maximum margin of sampling error is ±3 percentage points. In addition to sampling error, question wording and practical difficulties in conducting surveys can introduce error or bias into the findings of public opinion polls.

