With the 50th anniversary this year of the landmark Brown v. Board of Education ruling that outlawed racial segregation in schools, many are questioning whether the decision and subsequent desegregation programs achieved integration goals. Researchers for the Civil Rights Project at Harvard concluded that while the movement that began with Brown had "an enduring impact," America's schools are backsliding since court-ordered desegregation ended in many districts in the last decade. Although Â鶹´«Ã½AV does not have a 50-year trend on the racial and ethnic makeup of the nation's schools to show progress or regression, its latest poll on minority rights and relations* offers some insights on the current racial and ethnic makeup of the nation's schools.
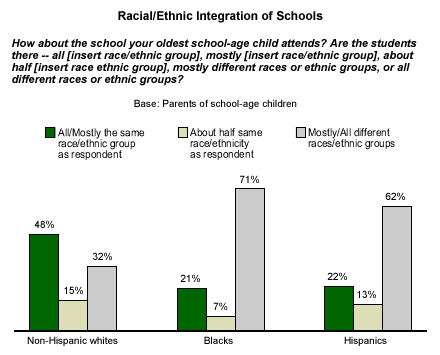
Many American children, especially those who are Hispanic or black, appear to be attending school with students of different races and ethnicities. Nearly three-fourths (71%) of blacks with school-age children say that most or all of the students at their oldest child's school are from different races or ethnic backgrounds, and 62% of Hispanic parents say the same. On the other hand, only about a third (32%) of white parents report that the students at their oldest child's school are mostly or all from different racial or ethnic groups.
About half (48%) of non-Hispanic whites describe their children's schoolmates as all or mostly white. About a fifth of blacks (21%) say students at their oldest child's school are all or mostly black, and 22% of Hispanics say students are all or mostly Hispanic -- indicating heterogeneity in the racial and ethnic composition of the schools that black children and Hispanic children attend.

Neighborhoods and Schools
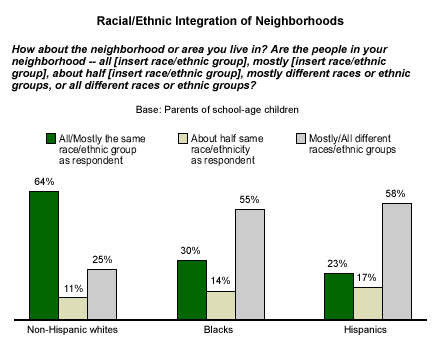
The poll results indicate that at least among non-Hispanic whites, neighborhoods are somewhat less integrated than schools. Whites are more likely to report that those in their neighborhoods are mostly or all the same race as they are (64%) than they are to report that the students in their child's school are mostly or all the same (48%). The makeup of black parents' neighborhoods follows a similar pattern of that in their schools -- 30% say that their neighborhood is mostly/all the same race, and 21% say their child's school is mostly/all the same race**. Hispanics also report a similar pattern in both their neighborhoods and schools. Twenty-three percent of Hispanics report their neighborhood is all or mostly the same race as they are, and 22% say so about their oldest child's school.

Bottom Line
In 1991, the Supreme Court ruled that school districts could end desegregation efforts (like busing and magnet schools) once the school districts were fully integrated. As a result, school districts could return to sending students to neighborhood schools or continue their integration policies without court order.
Regardless of whether or how schools choose to keep their schools integrated, the historically unpopular practice of busing white children and black children to schools outside their neighborhoods is slowly halting across the nation. Hillsborough County, Fla., which includes the city of Tampa, joined a growing list when it officially ended its 33-year-old busing program two weeks ago, after a judge declared the county free of segregation in 2001. Hillsborough County opted to replace its busing program with a controlled choice assignment plan, in which parents choose to send their children to schools outside their neighborhoods that have special programs and courses.
As the fate of integration increasingly ends up with school districts, rather than the courts, the future of integration is difficult to predict -- and odds are it will probably still be debated over the next 50 years.
*Results are based on telephone interviews with 2,250 national adults, aged 18 and older, conducted June 9-30, 2004, including oversamples of blacks and Hispanics that are weighted to reflect their proportions in the general population. For results based on the total sample of national adults, one can say with 95% confidence that the maximum margin of sampling error is ±5 percentage points.
Results for the sample of 816 non-Hispanic whites, aged 18 and older, are based on telephone interviews conducted June 9-30, 2004. For results based on the total sample, one can say with 95% confidence that the margin of sampling error is ±6 percentage points.
Results for the sample of 801 blacks, aged 18 and older, are based on telephone interviews conducted June 9-30, 2004. For results based on the total sample, one can say with 95% confidence that the margin of sampling error is ±8 percentage points.
Results for the sample of 503 Hispanics, aged 18 and older, are based on telephone interviews, conducted June 9-30, 2004. For results based on the total sample, one can say with 95% confidence that the margin of sampling error is ±8 percentage points. (164 out of the 503 interviews with Hispanics were conducted in Spanish).
**Results for the sample of 216 non-Hispanic whites who have a school-age child at home, aged 18 and older, are based on telephone interviews conducted June 9-30, 2004. For results based on the total sample, one can say with 95% confidence that the margin of sampling error is ±12 percentage points.
Results for the sample of 285 blacks who have a school-age child at home, aged 18 and older, are based on telephone interviews conducted June 9-30, 2004. For results based on the total sample, one can say with 95% confidence that the margin of sampling error is ±13 percentage points.
Results for the sample of 213 Hispanics who have a school-age child at home, aged 18 and older, are based on telephone interviews conducted June 9-30, 2004. For results based on the total sample, one can say with 95% confidence that the margin of sampling error is ±12 percentage points.