How many Americans have private health insurance? How many are covered by Medicare or Medicaid? And, how many have no coverage at all?
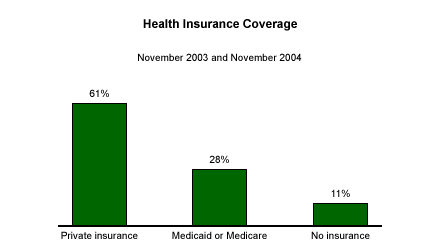
Each year, Â鶹´«Ã½AV asks the public several different questions designed to measure the type of personal health insurance coverage Americans have. The overall results, compiled from an aggregate of Â鶹´«Ã½AV's November 2003 and November 2004 health and healthcare surveys*, show that roughly 6 in 10 Americans (61%) have private health insurance coverage. Twenty-eight percent of adults nationwide are covered by Medicare or Medicaid, and 11% do not have any health insurance at all.
The data show interesting differences in coverage among different demographic subgroups.
Age
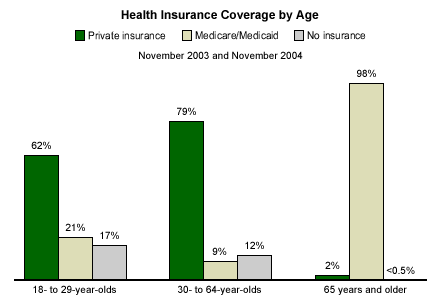
- Younger Americans are slightly more likely than those in other
age groups to have no health insurance coverage at all (17% of
those aged 18 to 29 vs. 12% of those aged 30 to 64 and less than 1%
of those aged 65 and older). Sixty-two percent of 18- to
29-year-olds say they have private health insurance, and 21% are
covered by Medicare or Medicaid.
- Nearly 8 in 10 adults aged 30 to 64 are covered by private
health insurance. Roughly 1 in 10 adults in this age group are
covered by Medicare or Medicaid.
- Almost all adults aged 65 and older -- 98% -- are covered by Medicare or Medicaid.
Income
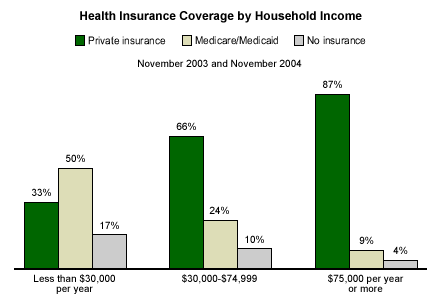
Lower-income households are considerably more likely to be covered by Medicaid or Medicare, while higher-income households are more likely to have private health insurance.
- Half of adults living in households with an annual income of
less than $30,000 say they are covered by Medicaid or Medicare. One
in three adults (33%) in this income group have private insurance,
and 17% have no insurance at all.
- Two in three adults earning between $30,000 and $75,000 per
year are covered by private health insurance, while 24% are covered
by Medicaid or Medicare and 10% have no coverage.
- Among those living in households earning $75,000 per year or more, 87% have private health insurance. Nine percent are covered by Medicaid or Medicare, and 4% have no insurance coverage.
Race
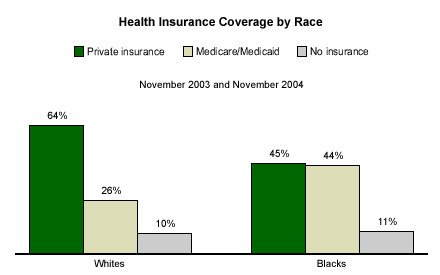
More than 6 in 10 non-Hispanic whites (64%) are covered by private health insurance, while 26% are covered by Medicaid or Medicare and 10% have no insurance at all. Blacks, meanwhile, are just as likely to be covered by Medicaid or Medicare (44%) as they are to have private health insurance coverage (45%). Eleven percent of blacks have no healthcare coverage.
Gender
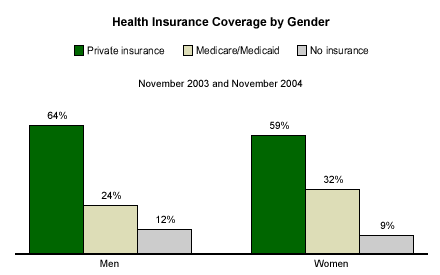
Men are somewhat more likely than women to have private healthcare coverage (64% vs. 59%), while women are slightly more likely to be covered by Medicaid or Medicare (32% to 24%). Women are more represented in the 65 and older population, which may partly explain this difference. Roughly the same proportions of men and women say they have no health insurance, but men are slightly more likely than women to say they have no health insurance.
Physical Disabilities and Long-Term Medical Conditions
Â鶹´«Ã½AV's 2004 health and healthcare survey** asked Americans if they have a "physical disability that limits their activity" or if they have "a long-term medical condition, illness or disease."
Overall, the current data show that 21% of Americans have a physical disability, while 79% do not. Women are slightly more likely than men to say they have a physical disability, by a margin of 25% to 18%. Older Americans also are more likely to report physical disabilities than are younger Americans. Thirty percent of those aged 50 and older have a physical disability, compared with 16% of those aged 30 to 49 and 13% of those aged 18 to 29.
Roughly 3 in 10 Americans (31%) report having a long-term medical condition, while 69% do not. Roughly the same proportion of men and women report having a long-term medical condition. Older Americans are considerably more likely to report having a long-term medical illness than younger people (43% of those aged 50 and older have a long-term condition vs. 24% of those aged 30 to 49 vs. 17% of those aged 18 to 29).
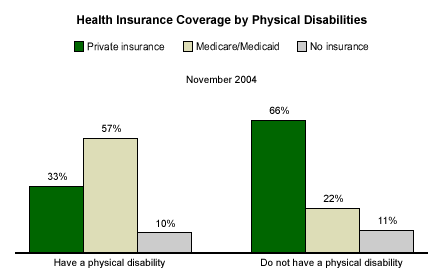
Americans with physical disabilities and long-term medical conditions are more likely than those who do not have these conditions to be covered by Medicaid or Medicare. The data show that 57% of Americans with a physical disability have Medicaid or Medicare coverage, while 33% have private insurance, and 10% have no insurance. It is important to note that those under age 65 with a physical disability may qualify for Medicare and Medicaid. Among those without a physical disability, two in three are covered by private health insurance.
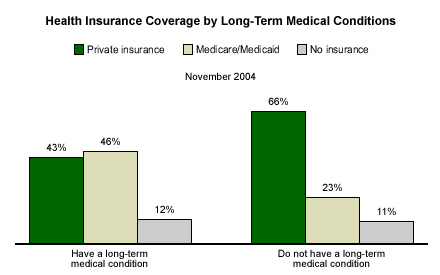
Americans with long-term medical conditions are almost equally likely to be covered by Medicaid or Medicare (46%) as they are to be covered by private insurance (43%). Eleven percent of Americans with a long-term medical condition have no insurance. Two in three Americans who do not suffer from a long-term illness or disease are covered by private health insurance.
*Results are based on telephone interviews with 2,025 national adults, aged 18 and older, conducted Nov. 3-5, 2003, and Nov. 7-10, 2004. For results based on the total sample of national adults, one can say with 95% confidence that the maximum margin of sampling error is ±2 percentage points.
**Results are based on telephone interviews with 1,016 national adults, aged 18 and older, conducted Nov. 7-10, 2004. For results based on the total sample of national adults, one can say with 95% confidence that the margin of sampling error is ±3 percentage points. In addition to sampling error, question wording and practical difficulties in conducting surveys can introduce error or bias into the findings of public opinion polls.