GALLUP NEWS SERVICE
PRINCETON, NJ -- A criminal justice milestone was reached on Dec. 2, when Kenneth Lee Boyd became the 1,000th person executed in the United States since the Supreme Court reinstated the death penalty in 1976. Boyd was put to death by lethal injection in North Carolina for killing his wife and father-in-law.
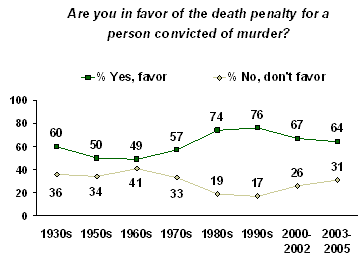
Americans' broad support for the death penalty has not wavered in the past few years. Â鶹´«Ã½AV's annual Crime survey, conducted Oct. 11-13, 2005, finds 64% of Americans in favor of the death penalty for persons convicted of murder; this is exactly the same percentage as found in 2003 and 2004.
However, according to the long-term trend, support for the death penalty is clearly lower today than in the recent past. From 2000 to 2002, the percentage in favor averaged 67%, and in the 1980s and 1990s, it averaged 75%. The highest individual measure of public support for the death penalty in Â鶹´«Ã½AV's trend was 80%, recorded 11 years ago in September 1994. The low point was 42% in 1966.

A separate question gauging death penalty support is asked each May as part of Â鶹´«Ã½AV's annual Values survey. Respondents are offered a choice between the death penalty and life imprisonment without parole as the better penalty for murder. According to the May 2005 survey, 56% of Americans prefer the death penalty and 39% prefer life imprisonment. This is a change from May 2004, when only 50% said they preferred the death penalty and 46% opted for life imprisonment. The current 56% is also higher than was recorded in 2001, when 52% preferred the death penalty.
These shifts run counter to the recent stability in the percentage saying they favor the death penalty for murder, and the slight decline in support for the death penalty seen since 2001.
Comparison of Trends in Death Penalty Support
|
Favor death penalty |
Prefer death penalty to |
|
|
% |
% |
|
|
2005 |
64 |
56 |
|
2004 |
64 |
50 |
|
2001 |
68 |
52 |
Historical Trends
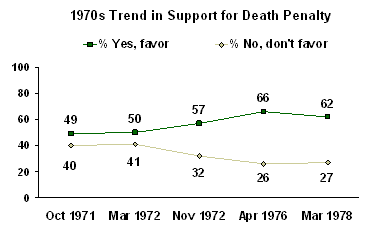
Â鶹´«Ã½AV's long-term trend on support for the death penalty suggests that shifting policy debates over the death penalty have shaped public opinion at times. In particular, it appears that the Supreme Court challenges to the death penalty in the 1970s may have sparked increased public support for the punishment.
For most of modern U.S. history, the death penalty was considered constitutional, and it was legal in most states. Then, in the 1972 landmark case of Furman v. Georgia, the Supreme Court determined the Georgia death penalty statute violated the Eighth Amendment's protection against cruel and unusual punishment because it gave juries complete latitude in sentencing. This decision voided 40 death penalty statutes nationwide. However, in the 1976 landmark Gregg decision, the court upheld the constitutionality of modified death penalty statutes in Florida, Georgia, and Texas, ushering in a new era of capital punishment.
After hovering around 50% in the early 1970s, the percentage of Americans in favor of the death penalty increased to 57% in November 1972 (after the Furman decision), and was 66% in April 1976 (three months before the Gregg decision was announced).

By 1985, support for the death penalty had reached 72% and it remained at approximately this level or higher through 1999.
More recently, the focus of death penalty legislation and litigation has been on limiting its application. In 2002, the Supreme Court ruled that the death penalty cannot be used with severely mentally retarded people, and in 2005, it ruled against executing juveniles. In January 2000, then-Gov. George Ryan of Illinois, a death penalty supporter, issued a moratorium in his state because of the high number of cases in which those on death row were ultimately proved not to be guilty of the crimes for which they were convicted.
Between February 1999 and February 2000, Â鶹´«Ã½AV saw a five-point decline in the percentage of Americans favoring the death penalty (from 71% to 66%). And except for one measure in October 2002, the percentage favoring the death penalty has since remained below 70%.
Variations in Support
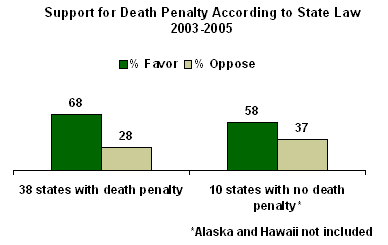
Today, 38 states have death penalty laws on the books, while 12 do not. An aggregate of Â鶹´«Ã½AV Polls from 2002 through today show only a slight difference in public opinion about the death penalty in these two groups of states.
In those states allowing the death penalty, 68% of adults favor capital punishment, while 28% oppose it. In states where the death penalty is not allowed, 58% of adults are in favor, while 37% are opposed.

Greater variation in death penalty attitudes is seen by party affiliation. According to the latest poll, more than three-quarters of Republicans (77%) and nearly two-thirds of independents (63%) favor capital punishment, compared with 56% of Democrats. Similarly, 74% of self-described "conservatives" and 64% of "moderates," versus 51% of "liberals", favor it.
Men are a bit more likely than women to be in favor: 70% vs. 59%. Consistent with previous Â鶹´«Ã½AV polling, there are strong differences by race, with most whites in favor of the death penalty and most nonwhites opposed to it, and no significant differences by age. While previous Â鶹´«Ã½AV Polls have found churchgoers to be slightly more opposed to the death penalty than non-churchgoers, the current poll finds no difference between the two groups.
Survey Methods
These results are based on telephone interviews with a randomly selected national sample of 1,012 adults, aged 18 and older, conducted Oct. 13-16, 2005. For results based on this sample, one can say with 95% confidence that the maximum error attributable to sampling and other random effects is ±3 percentage points. In addition to sampling error, question wording and practical difficulties in conducting surveys can introduce error or bias into the findings of public opinion polls.
10. Are you in favor of the death penalty for a person convicted of murder?
|
|
|
|
No |
|
|
% |
% |
% |
|
2005 Oct 13-16 |
64 |
30 |
6 |
|
|
|
|
|
|
2004 Oct 11-14 |
64 |
31 |
5 |
|
2003 Oct 6-8 |
64 |
32 |
4 |
|
2002 Oct 14-17 |
70 |
25 |
5 |
|
2001 Oct 11-14 |
68 |
26 |
6 |
|
2001 Feb 19-21 ^ |
67 |
25 |
8 |
|
2000 Aug 29-Sep 5 |
67 |
28 |
5 |
|
2000 Jun 23-25 |
66 |
26 |
8 |
|
2000 Feb 14-15 |
66 |
28 |
6 |
|
1999 Feb 8-9 |
71 |
22 |
7 |
|
1995 May 11-14 |
77 |
13 |
10 |
|
1994 Sep 6-7 |
80 |
16 |
4 |
|
1991 Jun 13-16 |
76 |
18 |
6 |
|
1988 Sep 25-Oct 1 |
79 |
16 |
5 |
|
1988 Sep 9-11 |
79 |
16 |
5 |
|
1986 Jan 10-13 |
70 |
22 |
8 |
|
1985 Nov 11-18 |
75 |
17 |
8 |
|
1985 Jan 11-14 |
72 |
20 |
8 |
|
1981 Jan 30-Feb 2 |
66 |
25 |
9 |
|
1978 Mar 3-6 |
62 |
27 |
11 |
|
1976 Apr 9-12 |
66 |
26 |
8 |
|
1972 Nov 10-13 |
57 |
32 |
11 |
|
1972 Mar 3-5 |
50 |
41 |
9 |
|
1971 Oct 29-Nov 2 |
49 |
40 |
11 |
|
1969 Jan 23-28 |
51 |
40 |
9 |
|
1967 Jun 2-7 |
54 |
38 |
8 |
|
1966 May 19-24 |
42 |
47 |
11 |
|
1965 Jan 7-12 |
45 |
43 |
12 |
|
1960 Mar 2-7 |
53 |
36 |
11 |
|
1957 Aug 29-Sep 4 |
47 |
34 |
18 |
|
1956 Mar 29-Apr 3 |
53 |
34 |
13 |
|
1953 Nov 1-5 |
68 |
25 |
7 |
|
1937 Dec 1-6 |
60 |
33 |
7 |
|
1936 Dec 2-7 |
59 |
38 |
3 |
|
^Asked of half-sample |
|
|
|
20. If you could choose between the following two approaches, which do you think is the better penalty for murder -- [ROTATED: the death penalty (or) life imprisonment, with absolutely no possibility of parole]?
BASED ON 489 NATIONAL ADULTS IN FORM B
|
The death |
Life |
No |
|
|
% |
% |
% |
|
|
2005 May 2-5 ^ |
56 |
39 |
5 |
|
|
|
|
|
|
2004 May 2-4 ^ |
50 |
46 |
4 |
|
2003 May 5-7 ^ |
53 |
44 |
3 |
|
2002 May 6-9 ^ |
52 |
43 |
5 |
|
2001 May 10-14 ^ |
52 |
43 |
5 |
|
2001 Feb 19-21 ^ |
54 |
42 |
4 |
|
2000 Aug 29-Sep 5 ^ |
49 |
47 |
4 |
|
2000 Feb 20-21 |
52 |
37 |
11 |
|
1999 Feb 8-9 ^ |
56 |
38 |
6 |
|
1997 Aug 12-13 ^ |
61 |
29 |
10 |
|
1994 June 22 |
50 |
32 |
18 |
|
1993 Oct 13-18 |
59 |
29 |
12 |
|
1992 Mar 30-Apr 5 |
50 |
37 |
13 |
|
1991 Jun 13-16 |
53 |
35 |
11 |
|
1986 Jan 10-13 |
55 |
35 |
10 |
|
1985 Jan 11-14 |
56 |
34 |
10 |
|
^Asked of a half sample |
|||
21. In your opinion, is the death penalty imposed -- [ROTATED: too often, about the right amount, or not often enough]?
|
Too |
About the |
Not |
No |
|
|
% |
% |
% |
% |
|
|
2005 May 2-5 |
20 |
24 |
53 |
3 |
|
|
|
|
|
|
|
2004 May 2-4 |
23 |
25 |
48 |
4 |
|
2003 May 5-7 |
23 |
26 |
48 |
3 |
|
2002 May 6-9 |
22 |
24 |
47 |
7 |
|
2001 May 10-14 |
21 |
34 |
38 |
7 |
