GALLUP NEWS SERVICE
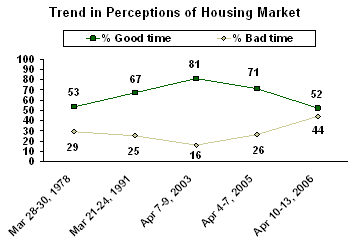
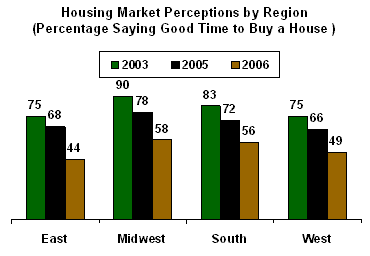
PRINCETON, NJ -- The volume of U.S. home sales is near the record high seen in 2005, but Americans are much less confident today than they were a year ago about the advisability of buying real estate. Just 52% of Americans say now is a good time to buy a house, down from 71% last April and 81% in 2003. Residents of the East and West are especially likely to consider it a bad time to purchase a new home.
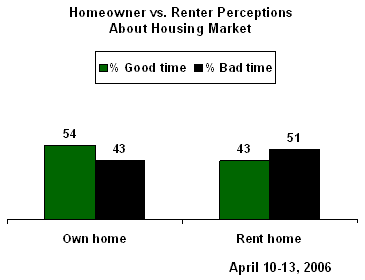
Homeowners today are slightly more positive than are renters about the current housing market. This is a change from a year ago when owners and renters had similar attitudes about buying a home, and perhaps reflects some homeowners' reasoning that the increased value of their current home cushions the blow of higher prices. Without that equity, renters are feeling squeezed out of the market.
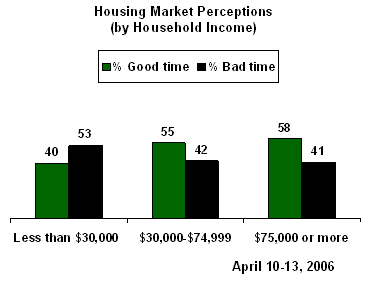
The buying climate remains more positive than negative among high- and middle-income households. A majority of those earning more than $30,000 per year still say it is a good time to buy. But lower-income Americans -- many of whom have been priced out of the housing market -- are generally discouraged.
Peak Phobia?
Housing looked like a good deal in the recent past when single-family homes were experiencing back-to-back years of double-digit appreciation and, in many markets, savvy investors could flip a home in a matter of months for a hefty profit. Now that the increases appear to be slowing, and home values are leveling off at fairly high prices, prospective buyers are naturally more concerned about paying top dollar. Rising mortgage interest rates -- though still "favorable" according to the National Association of Realtors -- may also diminish the degree to which Americans feel they can afford a new home.
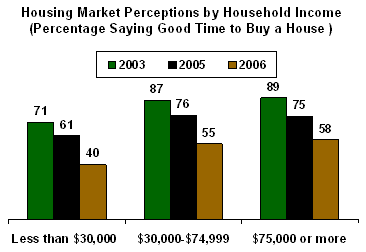
The recent decline in consumer optimism about the housing market is seen with all major income groups and regions of the country. Across three income levels -- high, medium, and low -- the percentage of Americans saying now is a good time to buy has declined by about a third just in the last year, and by even more since 2003.
Buying confidence has been consistently higher in the Midwest and South, but these regions have seen as much of a decline since 2003 as have the more subdued West, and nearly as much as the East. Confidence in the East today is the lowest of the four regions: only 44% say it is a good time to buy while 47% say it is a bad time. Also, confidence in the East has declined a bit more sharply compared with the rest of the country.
A Housing-Specific Decline
Americans' appetites for the housing market appear to be diminishing, and it's not due to their perceptions of overall economic conditions. Ratings of the national economy are about as negative today as a year ago. Roughly a third today call economic conditions "excellent" or "good" and even fewer believe conditions are improving.
There has also been no change in perceptions of local business conditions, the job market, or one's own financial situation. Fifty-one percent of Americans today, compared with 52% in 2005, say their finances are excellent or good.
By process of elimination, it seems clear that the plummet in perceptions that now is a good time to buy a house are based specifically on housing market trends. But whether these perceptions cause consumers to pull back and wait for the "housing bubble" to either burst or pass by, remains to be seen. At the moment, Americans are still buying.
Survey Methods
These results are based on telephone interviews with a randomly selected national sample of 1,005 adults, aged 18 and older, conducted April 10-13, 2006. For results based on this sample, one can say with 95% confidence that the maximum error attributable to sampling and other random effects is ±3 percentage points. In addition to sampling error, question wording and practical difficulties in conducting surveys can introduce error or bias into the findings of public opinion polls.
35. For people in general, do you think that now is a GOOD time or a BAD time to buy a house?
|
Good time |
Bad time |
BOTH/EQUALLY (vol.) |
No |
|
|
% |
% |
% |
% |
|
|
2006 Apr 10-13 |
52 |
44 |
-- |
4 |
|
|
|
|
|
|
|
2005 Apr 4-7 |
71 |
26 |
-- |
3 |
|
2003 Apr 7-9 |
81 |
16 |
-- |
3 |
|
1991 Mar 21-24 |
67 |
25 |
2 |
6 |
|
1978 Mar 28-30 |
53 |
29 |
8 |
10 |
|
(vol.) Volunteered response |
||||
36. Do you own or rent your primary residence?
|
Own |
Rent |
LIVE WITH PARENTS FOR FREE (vol.) |
Other |
No |
|
|
% |
% |
% |
% |
% |
|
|
2006 Apr 10-13 |
73 |
22 |
3 |
* |
1 |
|
|
|
|
|
|
|
|
2005 Aug 22-25 |
74 |
24 |
1 |
1 |
* |
|
2005 Apr 4-7 |
71 |
26 |
2 |
* |
1 |
|
2005 Mar 18-20 |
72 |
24 |
2 |
2 |
* |
|
2004 Apr 5-8 |
69 |
27 |
3 |
1 |
* |
|
2002 Nov 22-24 |
70 |
28 |
1 |
1 |
* |
|
2001 Apr 6-8 |
67 |
29 |
2 |
2 |
* |
|
(vol.) Volunteered response |
|||||
|
* Less than 0.5% |
|||||