GALLUP NEWS SERVICE
PRINCETON, NJ -- Â鶹´«Ã½AV's annual update on Americans' drinking habits shows beer again edging out wine as the adult beverage of choice. The percentage of Americans who drink any type of alcohol is stable, though the poll shows that more Americans are regular drinkers than a decade ago. Americans are dubious about the health benefits from regular drinking, as little more than one in five says drinking daily is good for one's health. These results are based on a July 12-15, 2007, Â鶹´«Ã½AV Poll.
Favorite Drink
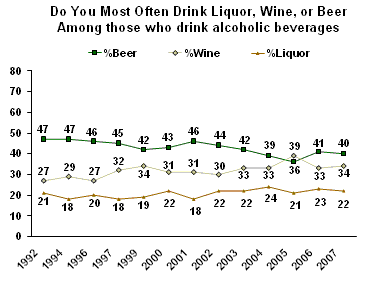
The 64% of Americans who say that they consume alcohol show a slight preference for beer (40%) over wine (34%) as their alcoholic beverage of choice, with liquor the favorite of 22%. Beer has typically enjoyed an advantage over wine throughout the years, but that advantage has narrowed recently, as a greater proportion of American drinkers say they drink wine most often and a lesser proportion say they drink beer. A 2005 poll showed the two were essentially tied, but beer has maintained a slight edge over wine in the past two polls. The percentage who rate liquor as their beverage of choice has been fairly stable over time.

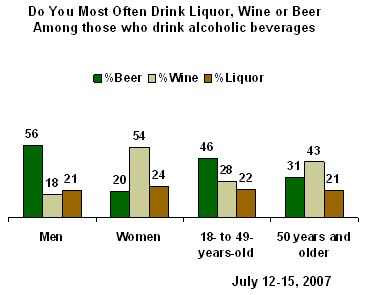
Male, female, younger, and older drinkers have different beverage preferences, primarily in regards to beer versus wine. Beer is the favored beverage among male drinkers and younger drinkers, while wine is the top choice among female drinkers and older drinkers.ÌýÌýÌý

Drinking Habits
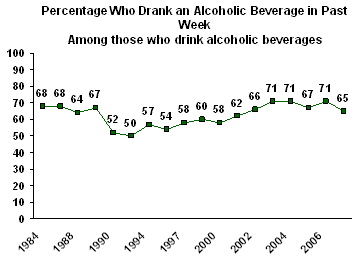
Â鶹´«Ã½AV has found little change in the incidence of drinking among the general public: The 64% of Americans who identify as drinkers in the July 2007 poll nearly matches the historical average of 63% since 1939. But, there has been a bit of a revival in regular drinking in recent years. In the early to mid-1990s, just over half of U.S. drinkers said they had consumed alcohol in the past week. Since 2002, that percentage has been 65% or higher in each poll, and surpassed 70% in several of these years. The current levels of regular drinking are similar to what Â鶹´«Ã½AV found in the 1980s.
 Ìý
Ìý
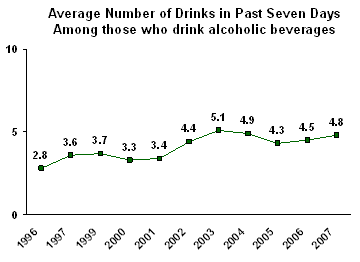
Because of the increase in regular drinking, the average number of weekly drinks Americans enjoy has increased significantly. According to the latest poll, the average drinker consumed 4.8 alcoholic beverages in the past week. Prior to 2001, the average number of weekly drinks had always been below four drinks, but has been above that mark since then.

The rise in regular drinking has occurred at about the same time some scientists have argued that daily moderate drinking has health benefits. (Whether the two are irrefutably linked in any way is unclear.) In the poll, 36% of drinkers reported having a drink in the past 24 hours, the same percentage as in the past three years.
Most Americans are, however, dubious of the claim of better health from drinking, as 22% say drinking in moderation is good for one's health. Twenty-five percent take the opposite view and believe that moderate drinking is detrimental to one's health, while the greatest percentage, 49%, believes it makes no difference. These views have been highly stable over the past seven years.
Those who drink daily are somewhat more likely to believe in the health benefits of regular, moderate drinking. Thirty-three percent of daily drinkers believe it is good for one's health, 55% say it makes no difference, and only 10% believe it is bad for one's health.
Survey Methods
These results are based on telephone interviews with a randomly selected national sample of 1,004 adults, aged 18 and older, conducted July 12-15, 2007. For results based on this sample, one can say with 95% confidence that the maximum error attributable to sampling and other random effects is ±3 percentage points.
For results based on the sample of 649 adults who drink alcoholic beverages, the maximum margin of sampling error is ±4 percentage points.
In addition to sampling error, question wording and practical difficulties in conducting surveys can introduce error or bias into the findings of public opinion polls.
25. Do you have occasion to use alcoholic beverages such as liquor, wine or beer, or are you a total abstainer?
ÌýÌýÌýÌýÌýÌýÌýÌýÌýÌýÌý
|
Yes,
|
No,
|
|
|
% |
% |
|
|
2007 Jul 12-15 |
64 |
36 |
|
Ìý |
Ìý |
|
|
2006 Jul 6-9 |
64 |
36 |
|
2005 Jul 7-10 |
63 |
37 |
|
2004 Jul 8-11 |
62 |
38 |
|
2003 Jul 7-9 |
62 |
38 |
|
2002 Jul 9-11 |
66 |
34 |
|
2001 Jul 19-22 |
62 |
38 |
|
2000 Nov 13-15 |
64 |
36 |
|
1999 Sep 23-26 |
64 |
36 |
|
1997 Jun 26-29 |
61 |
39 |
|
1996 Jun 27-30 |
58 |
42 |
|
1994 Jun 3-6 |
65 |
35 |
|
1992 Jan 16-19 |
64 |
35 |
|
1990 Dec 6-9 |
57 |
43 |
|
1989 Sep 12-15 |
56 |
44 |
|
1989 Apr 4-9 |
62 |
38 |
|
1988 Jul 1-7 |
63 |
37 |
|
1988 Mar 8-12 |
62 |
38 |
|
1987 Jul 10-13 |
65 |
35 |
|
1987 Apr 10-13 |
63 |
37 |
|
1987 Mar 14-18 |
65 |
35 |
|
1985 Feb 15-18 |
67 |
33 |
|
1984 Sep 6-9 |
64 |
36 |
|
1984 Jul 6-9 |
64 |
36 |
|
1983 Mar 11-14 |
65 |
35 |
|
1982 Aug 13-16 |
65 |
35 |
|
1981 Jan 9-12 |
70 |
30 |
|
1979 May 4-7 |
69 |
31 |
|
1978 Nov 10-13 |
66 |
34 |
|
1978 Apr 21-24 |
71 |
29 |
|
1977 Jan 14-17 |
71 |
29 |
|
1976ÌýÌýÌýÌýÌýÌý |
71 |
29 |
|
1974 May 10-13 |
68 |
32 |
|
1969 Jan 1-6 |
64 |
36 |
|
1969 Feb 22-27 |
63 |
37 |
|
1966 Jan 21-26 |
65 |
35 |
|
1964ÌýÌýÌýÌýÌýÌý |
63 |
37 |
|
1960 Mar 30-Apr 4 |
62 |
38 |
|
1959 Dec 10-15 |
61 |
39 |
|
1958 Jan 24-29 |
55 |
45 |
|
1957 Mar 15-20 |
58 |
42 |
|
1956 Jan 6-11 |
60 |
40 |
|
1952 Dec 11-16 |
60 |
40 |
|
1951 Aug 26-31 |
59 |
41 |
|
1950 Jun 4-9 |
60 |
40 |
|
1949 Dec 1-6 |
58 |
42 |
|
1947 Oct 3-8 |
63 |
37 |
|
1946 Jul 26-31 |
67 |
33 |
|
1945 Nov 23-28 |
67 |
33 |
|
1939 |
58 |
42 |
26. (Asked of those who drink alcohol) When did you last take a drink of any kind of alcoholic beverage?
ÌýÌýÌýÌýÌýÌýÌýÌýÌýÌýÌý BASED ON 649 WHO DRINK ALCOHOLIC BEVERAGES
|
|
Over 1
|
Over 1
|
|
|
|
% |
% |
% |
% |
|
|
2007 Jul 12-15 |
36 |
29 |
36 |
* |
|
Ìý |
Ìý |
Ìý |
Ìý |
|
|
2006 Jul 6-9 |
36 |
35 |
29 |
* |
|
2005 Jul 7-10 |
36 |
31 |
32 |
1 |
|
2004 Jul 8-11 |
33 |
38 |
29 |
* |
|
2003 Jul 7-9 |
31 |
40 |
29 |
* |
|
2002 Jul 9-11 |
28 |
38 |
34 |
* |
|
2001 Jul 19-22 |
30 |
32 |
38 |
* |
|
2000 Nov 13-15 |
26 |
32 |
42 |
* |
|
1999 Sep 23-26 |
35 |
25 |
39 |
1 |
|
1997 Jun 26-29 |
33 |
25 |
42 |
* |
|
1996 Jun 27-30 |
28 |
26 |
45 |
1 |
|
1994 Jun 3-6 |
34 |
23 |
42 |
1 |
|
1992 Jan 16-19 |
26 |
24 |
49 |
1 |
|
1990 Dec 6-9 |
29 |
23 |
47 |
1 |
|
1989 Sep 12-15 |
32 |
35 |
32 |
1 |
|
1988 Jul 1-7 |
39 |
25 |
34 |
2 |
|
1987 Jul 10-13 |
38 |
30 |
31 |
1 |
|
1984 Jul 6-9 |
39 |
29 |
31 |
1 |
|
* Less than 0.5% |
||||
27. (Asked of those who drink alcohol in past seven days) Approximately how many drinks of any kind of alcoholic beverages did you drink in the past SEVEN days?
ÌýÌýÌýÌýÌýÌýÌýÌýÌýÌýÌý
COMBINED RESULTS (Q.26-27): BASED ON 649 WHO DRINK ALCOHOLIC BEVERAGES
ÌýÌýÌýÌýÌýÌýÌýÌýÌýÌýÌýÌýÌýÌýÌýÌýÌýÌýÌýÌýÌýÌýÌý
|
|
|
|
|
Don't
|
|
|
|
|
% |
% |
% |
% |
% |
Ìý |
Ìý |
|
|
2007 Jul 12-15 |
37 |
48 |
9 |
5 |
1 |
4.8 |
2 |
|
Ìý |
Ìý |
Ìý |
Ìý |
Ìý |
Ìý |
Ìý |
|
|
2006 Jul 6-9 |
30 |
53 |
11 |
5 |
* |
4.5 |
2 |
|
2005 Jul 7-10 |
34 |
49 |
11 |
5 |
1 |
4.3 |
2 |
|
2004 Jul 8-11 |
31 |
55 |
8 |
5 |
1 |
4.9 |
2 |
|
2003 Jul 7-9 |
30 |
50 |
12 |
6 |
2 |
5.1 |
2 |
|
2002 Jul 9-11 |
34 |
50 |
9 |
5 |
2 |
4.4 |
2 |
|
2001 Jul 19-22 |
39 |
48 |
9 |
4 |
* |
3.4 |
1 |
|
2000 Nov 13-15 |
43 |
46 |
8 |
3 |
* |
3.3 |
1 |
|
1999 Sep 23-26 |
40 |
47 |
8 |
4 |
* |
3.7 |
2 |
|
1997 Jun 26-29 |
41 |
45 |
8 |
5 |
1 |
3.6 |
1 |
|
1996 Jun 27-30 |
47 |
42 |
7 |
2 |
2 |
2.8 |
1 |
|
1994 Jun 3-6 |
44 |
42 |
10 |
3 |
1 |
-- |
-- |
|
1992 Jan 16-19 |
51 |
36 |
10 |
2 |
1 |
-- |
-- |
|
1990 Dec 6-9 |
50 |
40 |
6 |
3 |
1 |
-- |
-- |
|
1989 Sep 12-15 |
33 |
47 |
13 |
5 |
2 |
-- |
-- |
|
1988 Jul 1-7 |
32 |
49 |
10 |
6 |
3 |
-- |
-- |
|
1987 Jul 10-13 |
29 |
50 |
11 |
6 |
4 |
-- |
-- |
|
* Less than 0.5% |
|||||||
28. (Asked of those who drink alcohol) Do you most often drink liquor, wine, or beer?
ÌýÌýÌýÌýÌýÌýÌýÌýÌýÌýÌý BASED ON 649 WHO DRINK ALCOHOLIC BEVERAGES
ÌýÌýÌýÌýÌýÌýÌýÌýÌýÌýÌýÌýÌýÌýÌýÌýÌýÌýÌýÌýÌýÌýÌý
|
|
|
|
All/Same (vol.) |
Other (vol.) |
No
|
|
|
% |
% |
% |
% |
% |
% |
|
|
2007 Jul 12-15 |
40 |
34 |
22 |
4 |
* |
* |
|
Ìý |
Ìý |
Ìý |
Ìý |
Ìý |
Ìý |
|
|
2006 Jul 6-9 |
41 |
33 |
23 |
3 |
-- |
* |
|
2005 Jul 7-10 |
36 |
39 |
21 |
3 |
* |
1 |
|
2004 Jul 8-11 |
39 |
33 |
24 |
4 |
* |
* |
|
2003 Jul 7-9 |
42 |
33 |
22 |
3 |
* |
* |
|
2002 Jul 9-11 |
44 |
30 |
22 |
3 |
1 |
* |
|
2001 Jul 19-22 |
46 |
31 |
18 |
4 |
* |
1 |
|
2000 Nov 13-15 |
43 |
31 |
22 |
3 |
0 |
1 |
|
1999 Sep 23-26 |
42 |
34 |
19 |
4 |
* |
1 |
|
1997 Jun 26-29 |
45 |
32 |
18 |
4 |
* |
1 |
|
1996 Jul 25-28 |
46 |
27 |
20 |
6 |
0 |
1 |
|
1994 Jun 3-6 |
47 |
29 |
18 |
3 |
1 |
2 |
|
1992 Jan 16-19 |
47 |
27 |
21 |
3 |
1 |
1 |
|
* Less than 0.5%
|
||||||
29. (Asked of those who drink alcohol) Do you sometimes drink more alcoholic beverages than you think you should?
ÌýÌýÌýÌýÌýÌýÌýÌýÌýÌýÌý BASED ON 649 WHO DRINK ALCOHOLIC BEVERAGES
ÌýÌýÌýÌýÌýÌýÌýÌýÌýÌýÌýÌýÌýÌýÌýÌýÌýÌýÌýÌýÌýÌýÌýÌýÌýÌýÌýÌýÌýÌýÌýÌýÌýÌýÌý
|
Yes |
No |
No
|
|
|
% |
% |
% |
|
|
2007 Jul 12-15 |
22 |
77 |
* |
|
Ìý |
Ìý |
Ìý |
|
|
2006 Jul 6-9 |
22 |
78 |
* |
|
2005 Jul 7-10 |
21 |
79 |
-- |
|
2004 Jul 8-11 |
25 |
75 |
* |
|
2003 Jul 7-9 |
24 |
76 |
* |
|
2002 Jul 9-11 |
21 |
79 |
* |
|
2001 Jul 19-22 |
20 |
80 |
* |
|
2000 Nov 13-15 |
26 |
74 |
* |
|
1999 Sep 23-26 |
24 |
76 |
* |
|
1997 Jun 26-29 |
22 |
78 |
* |
|
1996 Jul 25-28 |
25 |
75 |
* |
|
1994 Jun 3-6 |
29 |
71 |
-- |
|
1992 Jan 16-19 |
29 |
71 |
-- |
|
1990 Dec 6-9 |
23 |
76 |
1 |
|
1989 Sep 12-15 |
35 |
65 |
-- |
|
1987 Jul 1-7 |
29 |
71 |
-- |
|
1985 Feb 15-18 |
32 |
68 |
-- |
|
1978 Nov 10-13 |
23 |
77 |
-- |
|
* Less than 0.5% |
|||
30. Has drinking ever been a cause of trouble in your family?
ÌýÌýÌýÌýÌýÌýÌýÌýÌýÌýÌýÌýÌýÌýÌýÌýÌýÌýÌýÌýÌýÌýÌýÌýÌýÌýÌýÌýÌýÌýÌýÌýÌýÌýÌý
|
Yes |
No |
No answer |
|
|
% |
% |
% |
|
|
2007 Jul 12-15 |
35 |
65 |
* |
|
Ìý |
Ìý |
Ìý |
|
|
2006 Jul 6-9 |
29 |
71 |
* |
|
2005 Jul 7-10 |
29 |
71 |
* |
|
2004 Jul 8-11 |
37 |
63 |
-- |
|
2003 Jul 7-9 |
31 |
69 |
* |
|
2002 Jul 9-11 |
28 |
72 |
* |
|
2001 Jul 19-22 |
36 |
64 |
* |
|
2000 Nov 13-15 |
36 |
64 |
* |
|
1999 Sep 23-26 |
36 |
64 |
* |
|
1997 Jun 26-29 |
30 |
70 |
* |
|
1996 Jun 27-30 |
23 |
77 |
* |
|
1994 Jun 3-6 |
27 |
72 |
1 |
|
1992 Jan 16-19 |
24 |
76 |
-- |
|
1990 Dec 6-9 |
23 |
76 |
1 |
|
1989 Sep 12-15 |
19 |
81 |
-- |
|
1987 Mar 14-18 |
24 |
76 |
-- |
|
1985 Feb 15-18 |
21 |
79 |
-- |
|
1984 Jul 6-9 |
18 |
82 |
-- |
|
1981 |
22 |
78 |
-- |
|
1978 |
22 |
78 |
-- |
|
1976 |
17 |
83 |
-- |
|
1974 |
12 |
88 |
-- |
|
1966 |
12 |
88 |
-- |
|
1947 |
15 |
85 |
-- |
|
* Less than 0.5% |
|||
31. Do you, personally, think drinking in moderation -- that is, one or two drinks a day -- [ROTATED: is good for your health, makes no difference, or is bad for your health]?
|
Good for
|
Makes no
|
Bad for
|
No
|
|
|
% |
% |
% |
% |
|
|
2007 Jul 12-15 |
22 |
49 |
25 |
4 |
|
Ìý |
Ìý |
Ìý |
Ìý |
|
|
2005 Jul 7-10 |
25 |
51 |
22 |
2 |
|
2003 Jul 7-9 |
24 |
49 |
25 |
2 |
|
2001 Jul 19-22 |
22 |
46 |
27 |
5 |
